传统图像处理模块
| 更新时间 | 负责人 | 内容 | 备注 |
|---|---|---|---|
| 2022年4月13日 | Ray | 初次编写文档 | --- |
| 2022年4月24日 | Coty | 添加AprilTag识别、三维坐标系以及红蓝小球追踪 | --- |
| 2022年4月25日 | Coty | 添加AprilTag多个三维坐标显示,二维码和条形码的定位、读取信息 | --- |
| 2022年4月28日 | Dls | 修订排版,以下功能仅在 0.4.7 以上版本支持 | --- |
| 2022年7月04日 | Dls | 更新了 特征检测模块(特征提取追踪)相关的内容 | --- |
传统视觉模块
2022年07月22日 想参与开发的点此了解【图像处理开发】传统视觉算法
主要分为以下几大块:
图像统计模块(获取图像信息)
颜色追踪模块(追踪颜色信息)
标记追踪模块(条码定位测距)
图像滤波模块(传统图像处理)
特征检测模块(特征提取追踪)
from maix import image,display,camera
ROI=(80,30,15,15)
while True:
    img = camera.capture()
    tmp = img.get_statistics(roi=ROI)
    display.show(img)

    print("l Mean Median Mode STDev Min Max LQ UQ", tmp[0:8])
    print("a Mean Median Mode STDev Min Max LQ UQ", tmp[8:16])
    print("b Mean Median Mode STDev Min Max LQ UQ", tmp[16:24])

    # example data

    # openmv
    # "l_mean":42, "l_median":38, "l_mode":3, "l_stdev":27, "l_min":0, "l_max":100, "l_lq":19, "l_uq":65,
    # "a_mean":3, "a_median":1, "a_mode":0, "a_stdev":22, "a_min":-59, "a_max":81, "a_lq":-7, "a_uq":18,
    # "b_mean":5, "b_median":2, "b_mode":2, "b_stdev":27, "b_min":-88, "b_max":76, "b_lq":-12, "b_uq":25

    # maixpy3
    # 42, 37, 3, 27, 0, 98, 18, 66,
    # 2, -1, -1, 22, -72, 83, -8, 15,
    # 7, 1, -1, 26, -73, 76, -11, 25
[82, 98, 98, 19, 46, 98, 61, 98, 10, -1, -1, 15, -3, 44, -1, 20, 5, -1, -1, 9, -6, 31, -1, 13]Traceback (most recent call last): File "<string>", line unknown, in <module> Remote.KeyboardInterrupt
#!/usr/bin/python3
from maix import image, display, camera, gpio
camera.config(size=(240, 240))
import serial, time
ser = serial.Serial("/dev/ttyS1", 115200, timeout=0.2) # 连接串口
tmp = ser.readline()
print('serial test start ...')
ser.write(b" \r\n")
time.sleep(1)
ser.write(b"{V831:Ready!}\n")
set_LAB = [[(0, 46, 22, 61, -45, 74)], # red
[(3, 35, 8, 127, -128, -25)]] # blue
# LAB阈值的初始化格式:[L_MIN,A_MIN,B_MIN,L_MAX,A_MAX,B_MAX]
flag = '1'
now_time = time.time()
ser.write(b"ok\n")
while True:
img = camera.capture()
for j in range(2):
blobs = img.find_blobs(set_LAB[j]) # 在图片中查找lab阈值内的颜色色块
if blobs:
for i in blobs:
size = i["w"] * i["h"] # 最大是240 *240也就是57600
if size > 2000:
x_start = i["x"]
x_end = i["x"] + i["w"]
x_center = int((x_start + x_end) / 2) # 中心坐标
y_start = i["y"]
y_end = i["y"] + i["h"]
y_center = int((y_start + y_end) / 2)
m = max((x_center - i["w"] * 0.3), 0)
n = max((y_center - i["h"] * 0.3), 0)
m = min((x_center - i["w"] * 0.3), 240)
n = min((y_center - i["h"] * 0.3), 240)
mk = [int(m), int(n), 20, 20]
if (mk[0] + 20) < 220 and (mk[1] + 20) < 220:
git_color = img.get_blob_color(mk, 0, 0)
img.draw_rectangle(9, 9, 21, 21, color=(255, 255, 255), thickness=1) # 左上角颜色区域画出来
color = (int(git_color[0]), int(git_color[1]), int(git_color[2]))
img.draw_rectangle(10, 10, 20, 20, color, thickness=-1) # 将颜色填充到左上角
img.draw_circle(x_center, y_center, int(i["h"] / 2 + 8), color,
thickness=3) # 画一个中心点在(50,50),半径为20的空心 圆
if (j == 0):
string = 'Red'
elif j == 1:
string = 'Blue'
str_size = image.get_string_size(string)
img.draw_string(x_center - int(str_size[0] / 2) - 5, y_start - 35, string, scale=1.5,
color=(int(git_color[0]), int(git_color[1]), int(git_color[2])), thickness=2)
if flag == '1':
flag = '0'
now_time = time.time() # time.asctime()
display.show(img)
time_t = time.time() - now_time
if (time_t > 0.03):
if flag == '0':
tep = "{V831:Space_x->" + str(x_center - 120) + "}" # 先获得数据
ser.write(tep.encode("utf-8")) # 变成串口能发送的格式发出去
flag = 'x' # 先发X再发Y,需要等等不然32会反映不过来,但又不能阻塞
elif flag == 'x':
flag = '1'
tep = "{V831:Space_y->" + str(y_center - 120) + "}" # 先获得数据
ser.write(tep.encode("utf-8")) # 变成串口能发送的格式发出去
此代码配合其他MCU运行效果演示如图所示:
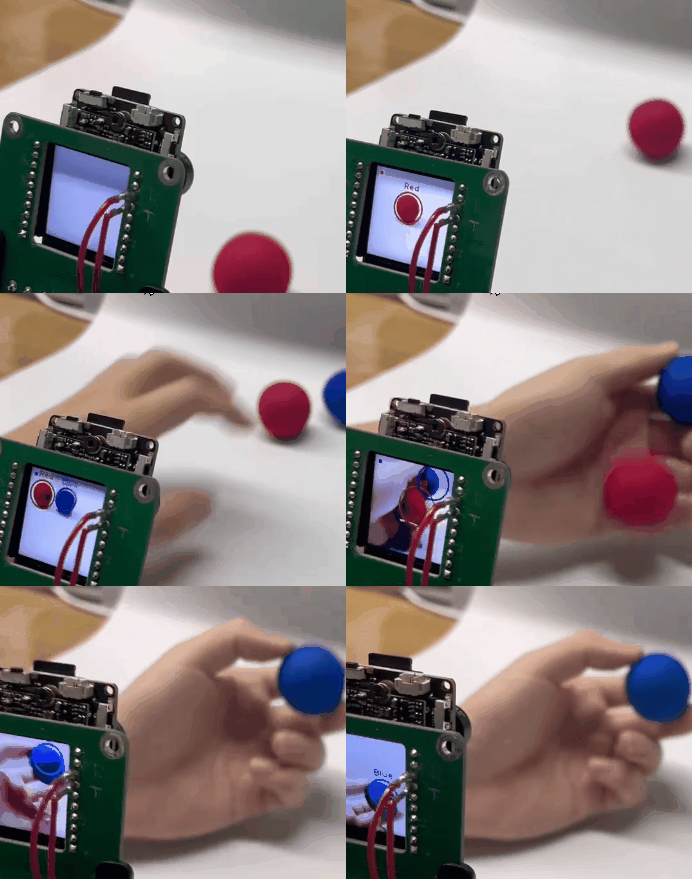
从演示图可以看出,MaixII-Dock 成功获得了小球距离中心点的偏差,通过串口发送数据给 MCU ,通过 PID 控制舵机带动摄像头转动,使得小球重新回归中心点位。
set_LAB = [[(10, 35, -37, 70, 73, 62)], #red
[(10, 5, -87, 79, 62, -28)]] #blue
对于LAB阈值的设置需要注意的是初始化的格式,格式为:[L_MIN , A_MIN , B_MIN , L_MAX , A_MAX , B_MAX],此处初始化了红色和蓝色的LAB阈值。
blobs = img.find_blobs(set_LAB[j])
find_blobs() 函数目的是寻找对应的色块。
将目标区域的信息获取之后使用 img.draw_circle() 函数将目标圈住,最后将球距离中心点的偏差值( x 和 y 的偏差值)发送至 MCU,由 MCU 进行后续的计算。
#!/usr/bin/python3
from maix import display, camera
f_x = (6 / 5.76) * 240 # 镜头的焦距是6MM,感光cmos的长是5.76mm,240像素是屏幕的长
f_y = (6 / 3.24) * 240 # 镜头的焦距是6MM,感光cmos的宽是3.24mm,240像素是屏幕的宽
c_x = 240 * 0.5 # 屏幕分辨率的一半
c_y = 240 * 0.5 # 屏幕分辨率的一半
while True:
t = camera.capture()
mks = t.find_apriltags(families = 16,fx = f_x,fy = f_y,cx = c_x,cy = c_y)
for mk in mks:
x_tran = mk['x_translation']
y_tran = mk['y_translation']
z_tran = mk['z_translation']
#家族信息
fam = mk['family']
#外框数据
x, y, w, h, id = mk['x'], mk['y'], mk['w'], mk['h'], mk['id']
#内框数据
x1,y1 = mk['corners'][0] #访问字典的列表
x2,y2 = mk['corners'][1]
x3,y3 = mk['corners'][2]
x4,y4 = mk['corners'][3]
z1,z2 = mk['centroid']
#虚拟距离
length = (x_tran*x_tran + y_tran*y_tran + z_tran*z_tran)**0.5
#画外框
t.draw_rectangle(x, y, x + w, y + h, color=(0, 0, 255), thickness = 2)
#打印ID
t.draw_string(int(x + w*0.15) , int(y + h*0.15) , str(id), scale = 4.0, color = (255, 0, 0), thickness = 3)
#画内框
t.draw_line(x1, y1, x2, y2, color = (0, 255, 0), thickness = 3)
t.draw_line(x2, y2, x3, y3, color = (0, 255, 0), thickness = 3)
t.draw_line(x3, y3, x4, y4, color = (0, 255, 0), thickness = 3)
t.draw_line(x4, y4, x1, y1, color = (0, 255, 0), thickness = 3)
if(fam == 16):
t.draw_string(x, y-20, "TAG36H11", scale = 1.0, color = (255, 0, 0), thickness = 2)
t.draw_string(x, y+h+15, str(int(length * 3.0649 - 2))+" cm", scale = 1.0, color = (255, 0, 0), thickness = 2)
display.show(t)此代码运行效果演示如图所示:
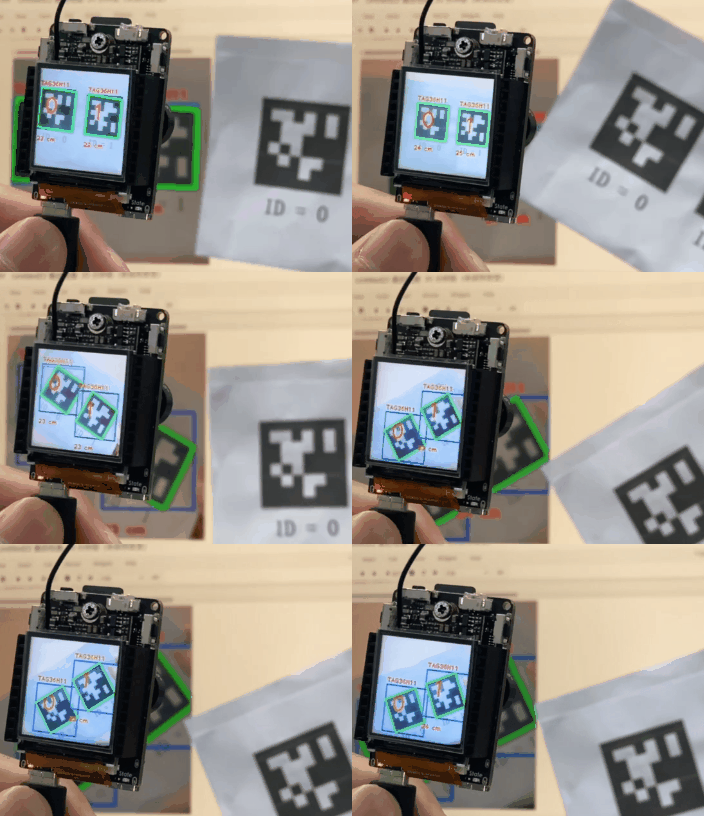
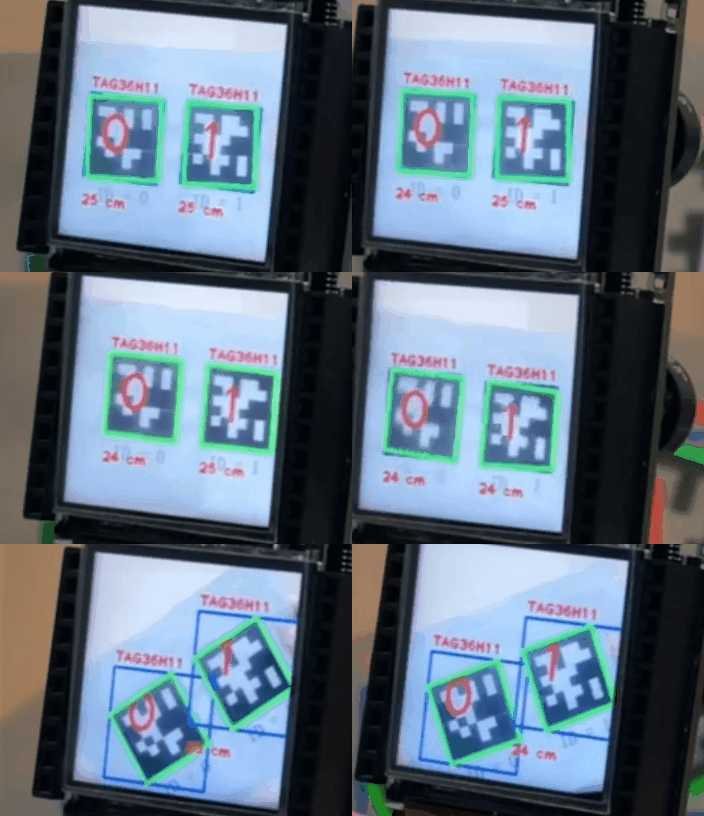
在演示1中可以看到 MaixII-Dock 能够清楚地跟踪标签四个点的坐标并且显示出来(绿色框),以及能够跟踪标签的最大框的坐标(蓝色框),其实用户想要获取这些信息并不难。
如果想要获取标签四个点的坐标只需要获取字典中键值为 corners 的列表中的值即可,而想获得外框(蓝色框)的坐标只需要获取字典中键值为 x , y , w , h 的的值,最后像代码中所操作的一样即可。
字典的键值如下所示: 'x' , 'y' , 'w' , 'h' , 'id' , 'family' , 'centroid' , 'corners' , 'x_translation' , 'y_translation' , 'z_translation' , 'decision_margin' , 'hamming' , 'goodness' , 'x_rotation' , 'y_rotation' , 'z_rotation'。
在此仅介绍简单几个键值的含义。'x' , 'y' , 'w' , 'h' 键值返回的值分别是外框左上角 x 坐标和 y 坐标以及外框的长和宽。特别注意的是键值 'corners' 返回的是一个列表,列表中的值代表着内框的四个顶点的坐标。
在演示2中可以看到两个标签距离摄像头大概是22cm左右,那么究竟是如何测出这个距离的呢?请接着往下看:
对于测距算法,需要知道的是:
fx,以像素为单位的相机 X 焦距;
fy,以像素为单位的相机 Y 焦距;
cx,图像中心image.width()/2;
cy,图像中心image.height()/2;
具体 fx , fy , cx , cy 的计算在上诉代码注释区。
测距算法使用流程:首先将 fx ,fy ,cx ,cy 传入 find_apriltags() 函数内部,读取返回的 x_translation ,y_translation ,z_translation 参数。由length = (x_tranx_tran + y_trany_tran + z_tranz_tran)*0.5 可以算出虚拟距离,这个虚拟距离 length 乘上一个比例系数 K 才是最终物体离 CMOS 的最终距离。
比例系数 K 的计算:假设我们现在将一个物体放置在离 CMOS 距离 20cm 的地方,然后直接打印出 length 计算的结果,此时的 length 假设是 6.525 ,那么 K = 20 / 6.525 = 3.065。这时我们将 length 乘上这个比例系数 K 得出的结果就是真实的距离。也就是说在第一次使用的时候需要确定比例系数 K ,在确定了 K 的大小过后,以后的使用就直接使用计算出来的比例系数 K 乘上计算出来的虚拟距离 length ,就是最后真实的距离。(需要注意的是:最后算出的真实距离并不是标签距离摄像头的距离,而是标签距离CMOS的距离。以MaixII-Dock为例,标配的摄像头镜头距离CMOS的距离大概是2cm,那么需要将最后算出的距离再减去2cm最后得出的结果才是标签距离摄像头的距离。)
#!/usr/bin/python3
from maix import display, camera
import math
f_x = (6 / 5.76) * 240 # 镜头的焦距是6MM,感光cmos的长是5.76mm,240像素是屏幕的长
f_y = (6 / 3.24) * 240 # 镜头的焦距是6MM,感光cmos的宽是3.24mm,240像素是屏幕的宽
c_x = 240 * 0.5 # 屏幕分辨率的一半
c_y = 240 * 0.5 # 屏幕分辨率的一半
while True:
t = camera.capture()
mks = t.find_apriltags(families = 16,fx = f_x,fy = f_y,cx = c_x,cy = c_y)
for mk in mks:
#内框数据
x1,y1 = mk['corners'][0] #访问字典的列表
x2,y2 = mk['corners'][1]
x3,y3 = mk['corners'][2]
x4,y4 = mk['corners'][3]
#获取角度信息
x_rol = mk['x_rotation']
y_rol = mk['y_rotation']
z_rol = mk['z_rotation']
#画内框
t.draw_line(x1, y1, x2, y2, color = (0, 255, 0), thickness = 3)
t.draw_line(x2, y2, x3, y3, color = (0, 255, 0), thickness = 3)
t.draw_line(x3, y3, x4, y4, color = (0, 255, 0), thickness = 3)
t.draw_line(x4, y4, x1, y1, color = (0, 255, 0), thickness = 3)
#显示当前角度
t.draw_string(2, 2, "X rotation is: "+str(int(180*x_rol/3.14))+" Angle", scale = 1.0, color = (0, 0, 255), thickness = 1) #90° ~ 270° 正对着是180°。上下
t.draw_string(2, 15, "Y rotation is: "+str(int(180*y_rol/3.14))+" Angle", scale = 1.0, color = (0, 0, 255), thickness = 1) #0° ~ 90°,270° ~ 360° 正对着是0°。 左右
t.draw_string(2, 30, "Z rotation is: "+str(int(180*z_rol/3.14))+" Angle", scale = 1.0, color = (0, 0, 255), thickness = 1) #0° ~ 360° 正对着是0°。 顺时针旋转增加
#右下角画框
t.draw_string(140, 120, "Space", scale = 1.0, color = (125, 0, 0), thickness = 2)
t.draw_rectangle(140, 140, 235, 235, color=(128, 128, 128), thickness=2)
#画出三维坐标系
t.draw_line(180, 200, int(180 - 40 * math.sin(z_rol)), int(240 - 40 * math.cos(z_rol) + 40 * math.cos(x_rol)), color = (255, 0, 0), thickness = 3)
t.draw_line(180, 200, int(140 + 40 * math.cos(z_rol) + 40 * math.cos(y_rol)), int(200 - 40 * math.sin(z_rol)), color = (0, 255, 0), thickness = 3)
t.draw_line(180, 200, int(180 + 40 * math.sin(y_rol)),int(200 - 40 * math.sin(x_rol)), color = (0, 0, 255), thickness = 3)
display.show(t)此代码运行效果演示如图所示:

可以看出在显示屏左上角打印出了标签的当前角度信息,那么如何获取这些信息呢?
如果想要获取标签的角度信息只需要获取字典中键值分别是 x_rotation,y_rotation,z_rotation 的的值即可,需要指出的是获取的值是弧度,需要转换成角度的话需要使用弧度转角度公式。将获取的弧度其乘上 180 再除以 3.14 即可(3.14选取了圆周率小数点后两位)。
x_rotation 转为角度后取值范围是 [90°,270°] 正对着标签时显示为 180° ,在标签前后移动时变化。 y_rotation 转为角度后取值范围是 [0°,90°]U[270°,360°] 正对着标签时显示为 0° ,在标签左右移动时变化。z_rotation 转为角度后取值范围是 [0°,360°] 正对着标签时显示为 0° ,在标签旋转时变化。
三维坐标系显示
三维坐标系生成代码如上代码中所示,将每一个轴的变化线性叠加即可获得一个不太准确的三维坐标系。
前后的变化会导致 x_rotation 的变化。当 x_rotation 变化时,X 轴 y 的长度应该为 40 * cos(x_rol) ,但是 x_rotation 转换为角度的范围是 [90°,270°] 且正对标签时为 180°,画出 cos 图发现在定义域内 180° 点为极小值点,且整个取值区域内 cos 值都为负,我们不希望得到这样的图像。解决方法是将 cos 向上平移 40 ,使得 180° 点cos值为 0 ,而 90° 和 270° 为区间的最高点,是一个正数。此时终点 y 的结果为 **200 + 40 + 40 * cos(x_rol),即转至 90° 或 270° 时,X 轴的长度为 200,与开始点重合,实际长度为 0 。而对于 Z 轴的长度处理思路相似,但是 Z 轴的投影使用的是 sin 函数,在 [90°,270°] 这个区间 90° 是极大值点且此时 sin 值为正数,270° 是极小值点且此时 sin 值为负数,正好符合实际需求,故不作处理。最后 Z 轴终点 y 的结果为200 - 40 * sin(x_rol)**。
左右的变化会导致 y_rotation 的变化。当 y_rotation 变化时,Y 轴 x 的长度应该为 40 * cos(y_rol),但是 y_rotation 转换为角度的范围是 [0°,90°]U[270°,360°],且正对标签时为 0°,画出cos图发现图像被分割为了两个部分,但是不影响使用,因为在角度 [270°,360°] 内会随着倾角的增大而逐渐减小,所以最后终点 x 的结果是 **180 + 40 * cos(y_rol)。而对于 Z 轴的长度处理思路相似,此处不做过多解释,最终 Z 轴终点 x 的结果为180 + 40 * sin(y_rol)**。
旋转的变化会导致 z_rotation 的变化。当 z_rotation 变化时,X 轴 x 的长度应该为 40 * sin(z_rol),但此时由于 z_rotation 转换而来的角度会随着逆时针的转动而增大,所以 X 轴 x 的长度应该乘以 -1 ,这样才能符合实际变化,最后终点 x 的结果为**180 - 40 * sin(z_rol)**。X 轴 y 的长度为 40 * cos(z_rol),但是屏幕从上而下的像素点的值是逐渐增大的,所以虽然 cos 值在区间内部的变化是符合我们的预期,但是依旧要乘以 -1,最后终点 y 结果为 **200 - 40 * cos(z_rol)。对于 Y 轴的 x 和 y 的长度处理思路与上诉一样,但对于 x 的长度需要减去一个 40 抵消掉初始增量,最后终点结果分别为 180 - 40 + 40 * cos(z_rol)** 和 **200 - 40 * sin(z_rol)**。
最后将所有计算式线性叠加即可获得最终三维坐标系。由于算式是基于正对着标签码进行计算的,所以对于非正拿标签的情况,坐标系会出现混乱
from maix import display, camera
import math
f_x = (6 / 5.76) * 240
f_y = (6 / 3.24) * 240
c_x = 240 * 0.5
c_y = 240 * 0.5
while True:
t = camera.capture()
mks = t.find_apriltags(families = 16,fx = f_x,fy = f_y,cx = c_x,cy = c_y)
for mk in mks:
#内框数据
x1,y1 = mk['corners'][0] #访问字典的列表
x2,y2 = mk['corners'][1]
x3,y3 = mk['corners'][2]
x4,y4 = mk['corners'][3]
x_rol = mk['x_rotation']
y_rol = mk['y_rotation']
z_rol = mk['z_rotation']
#画内框
t.draw_line(x1, y1, x2, y2, color = (0, 255, 0), thickness = 3)
t.draw_line(x2, y2, x3, y3, color = (0, 255, 0), thickness = 3)
t.draw_line(x3, y3, x4, y4, color = (0, 255, 0), thickness = 3)
t.draw_line(x4, y4, x1, y1, color = (0, 255, 0), thickness = 3)
t.draw_string(x4, y4, "xR: "+str(int(180*x_rol/3.14)), scale = 1.0, color = (255, 0, 0), thickness = 2) #90° ~ 270° 正对着是180°。上下
t.draw_string(x4, y4 + 15, "yR: "+str(int(180*y_rol/3.14)), scale = 1.0, color = (255, 0, 0), thickness = 2) #0° ~ 90°,270° ~ 360° 正对着是0°。 左右
t.draw_string(x4, y4 + 30, "zR: "+str(int(180*z_rol/3.14)), scale = 1.0, color = (255, 0, 0), thickness = 2) #0° ~ 360° 正对着是0°。 顺时针旋转增加
t.draw_line(x4, y4, int(x4 - 40 * math.sin(z_rol)), int(y4 + 40 - 40 * math.cos(z_rol) + 40 * math.cos(x_rol)), color = (255, 0, 0), thickness = 3)
t.draw_line(x4, y4, int(x4 - 40 + 40 * math.cos(z_rol) + 40 * math.cos(y_rol)), int(y4 - 40 * math.sin(z_rol)), color = (0, 0, 0), thickness = 3)
t.draw_line(x4, y4, int(x4 + 40 * math.sin(y_rol)),int(y4 - 40 * math.sin(x_rol)), color = (0, 0, 255), thickness = 3)
display.show(t)此代码运行效果演示如图所示:
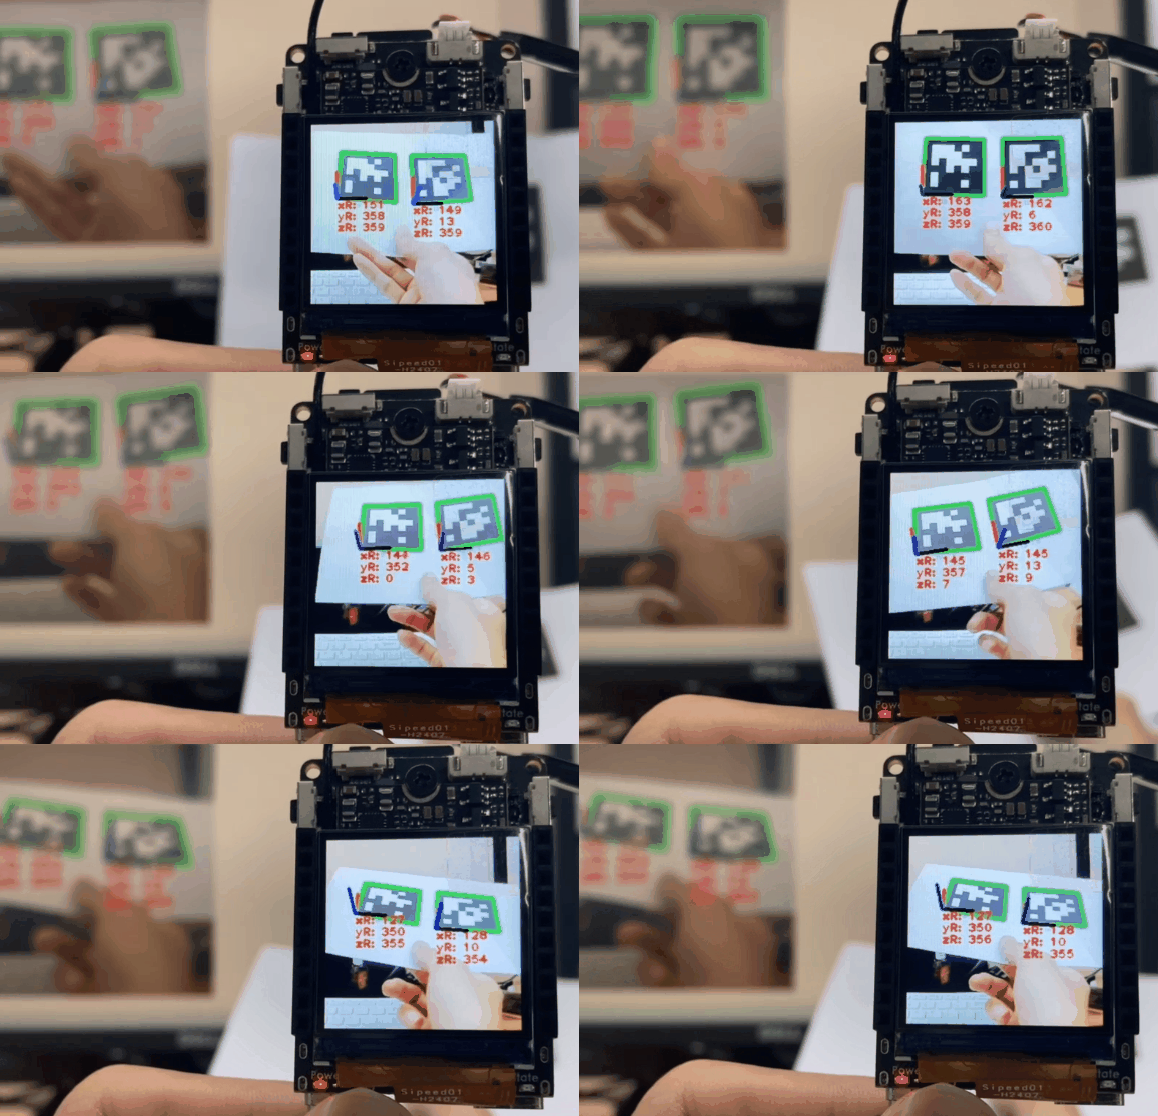
在演示图中可以看到在每个标签上都打印出了一个三维坐标系,并且能够很好显示当前标签的角度信息。只需要将三维坐标系的原点定义在标签的左下角,且将三维坐标画线函数放置在for循环内部,即可出现如上图所示效果。
#!/usr/bin/python3
from maix import display, camera
while True:
t = camera.capture()
mks = t.find_qrcodes()
for mk in mks:
#外框数据
X = mk['x']
Y = mk['y']
W = mk['w']
H = mk['h']
#二维码信息
string = mk['payload']
#内框数据
x1,y1 = mk['corners'][0] #访问字典的列表
x2,y2 = mk['corners'][1]
x3,y3 = mk['corners'][2]
x4,y4 = mk['corners'][3]
#画外框
t.draw_rectangle(X, Y, X + W, Y + H, color=(0, 0, 255), thickness = 2)
#打印信息
t.draw_string(int(X) , int(Y - 35) , str(string), scale = 2.0, color = (255, 0, 0), thickness = 2) #内框ID
#画内框
t.draw_line(x1, y1, x2, y2, color = (0, 255, 0), thickness = 3)
t.draw_line(x2, y2, x3, y3, color = (0, 255, 0), thickness = 3)
t.draw_line(x3, y3, x4, y4, color = (0, 255, 0), thickness = 3)
t.draw_line(x4, y4, x1, y1, color = (0, 255, 0), thickness = 3)
display.show(t)
此代码运行效果演示如图所示:
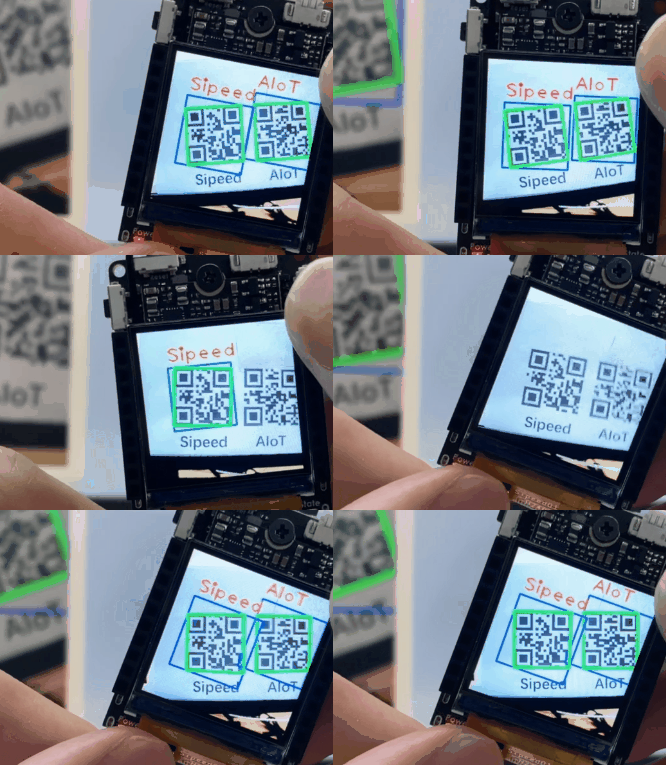
在演示中可以看到 MaixII-Dock 能够清楚地跟踪并且框住二维码,将二维码信息打印到屏幕上。那么如何获取二维码坐标值以及信息呢?其实非常简单。
- 获取外框坐标:读取 find_qrcodes() 函数返回的字典中键值为: x , y , w , h 的值作为二维码外框的坐标信息(蓝色框)。
- 获取内框坐标:读取 find_qrcodes() 函数返回的字典中键值为: corners 的列表中的值作为二维码内框的坐标(绿色框)。
- 获取二维码信息:读取 find_qrcodes() 函数返回的字典中键值为: payload 的值作为二维码信息。
字典的键值如下所示:'x' , 'y' , 'w' , 'h' , 'payload' , 'version' , 'ecc_level' , 'mask' , 'data_type' , 'eci' , 'corners'。
在此仅介绍简单几个键值的含义。'x' , 'y' , 'w' , 'h' 键值返回的值分别是外框左上角 x 坐标和 y 坐标以及外框的长和宽。而键值 'payload' 返回的值是二维码的信息,例如在二维码生成网站上输入 "Sipeed" 生成二维码,此时这个二维码的 'payload' 就是 "Sipeed"。
#!/usr/bin/python3
from maix import display, camera
while True:
t = camera.capture()
mks = t.find_barcodes()
for mk in mks:
#二维码信息
string = mk['payload']
TYPE = mk['type']
#内框数据
x1,y1 = mk['corners'][0] #访问字典的列表
x2,y2 = mk['corners'][1]
x3,y3 = mk['corners'][2]
x4,y4 = mk['corners'][3]
#画内框
t.draw_line(x1, y1, x2, y2, color = (0, 255, 0), thickness = 3)
t.draw_line(x2, y2, x3, y3, color = (0, 255, 0), thickness = 3)
t.draw_line(x3, y3, x4, y4, color = (0, 255, 0), thickness = 3)
t.draw_line(x4, y4, x1, y1, color = (0, 255, 0), thickness = 3)
#打印信息
t.draw_string(int(x1) , int(y1 - 35) , str(string), scale = 2.0, color = (255, 0, 0), thickness = 2)
t.draw_string(int(x1) , int(y1 + 35) , str(TYPE), scale = 2.0, color = (255, 0, 0), thickness = 2)
display.show(t)
此代码运行效果演示如图所示:
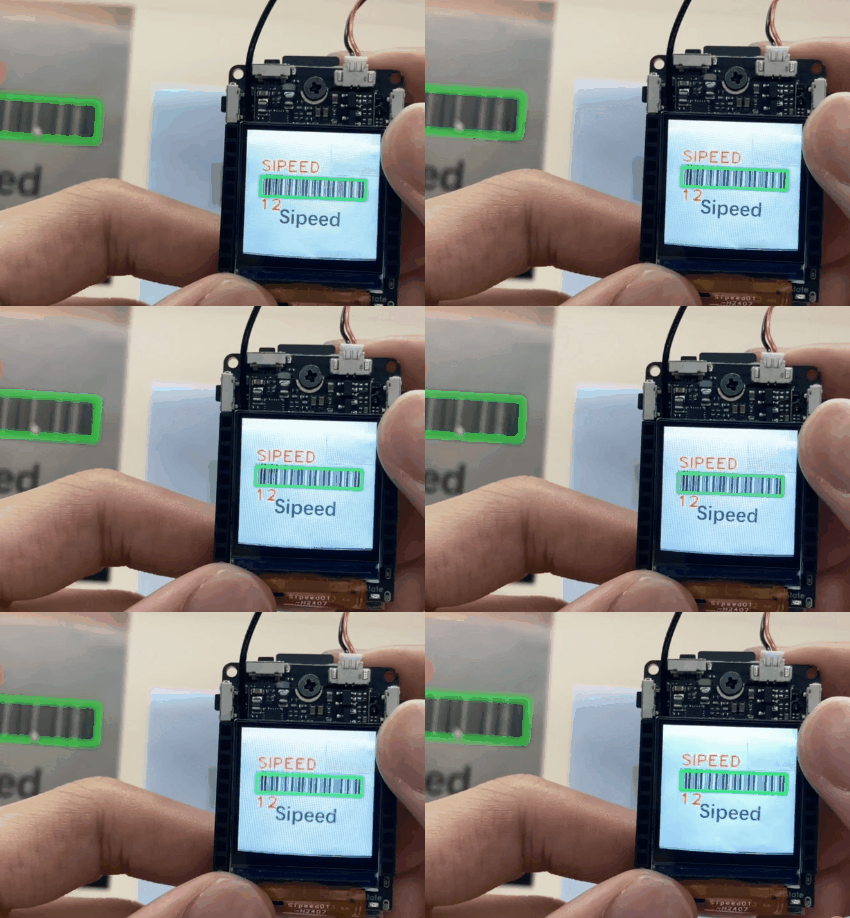
在演示中可以看到 MaixII-Dock 能够清楚地跟踪并且框住条形码,将条形码信息以及类型打印到屏幕上。那么如何获取二维码坐标值以及相关信息呢?其实非常简单。
- 获取条形码坐标:读取 find_barcodes() 函数返回的字典中键值为: corners 的列表中的值作为条形码的坐标(绿色框)。
- 获取条形码信息:读取 find_barcodes() 函数返回的字典中键值为: payload 的值作为条形码信息。
- 获取条形码类型:读取 find_barcodes() 函数返回的字典中键值为: type 的值作为条形码的类型 (注意:此处条形码类型选择的是 CODE39 ,故键值为 type 返回的值为 12 ,如果将条形码类型换为 CODE128 ,则键值为 type 返回的值为 15 )。
字典的键值如下所示:'x' , 'y' , 'w' , 'h' , 'payload' , 'rotation' , 'type' , 'quality' , 'corners'。
在此仅介绍简单几个键值的含义。'corners' 键值返回的是一个列表,列表中的值分别条形码四个顶点的坐标。而键值 'type' 返回的值是条形码的类型,'payload' 返回的值是条形码的内容。
图像滤波模块 (maixpy3 >= 0.4.9)
为 maixpy3 添加 opencv 的函数请看这个提交 [image] How to add _opencv_Canny.。
为 maixpy3 添加 openmv 的函数请看这个提交[example] use costom_imlib_config and image imlib_rotation_corr.。
- lens_corr
- rotation_corr
- histeq
- mean
- Canny
暂不做接口说明,但均已实现,详细请看源码。
from maix import camera, display, image
while True:
display.show(camera.capture().Canny())Traceback (most recent call last): File "<string>", line unknown, in <module> Remote.KeyboardInterrupt
from maix import image, display, camera
tmp = image.open("/root/template.png")
tmp = camera.capture()
display.show(tmp)[ rpyc-kernel ]( running at Mon Jul 4 10:31:48 2022 )
from maix import image, display, camera
tmp = image.open("/root/template.png")
while True:
img = camera.capture()
res = img.find_template(tmp, 0.5, step=8, search=0)
if len(res):
img.draw_rectangle(res["x"], res["y"], res["x"] + res["w"], res["y"] + res["h"], color=(0, 0, 255), thickness=1)
img.draw_string(res["x"], res["y"], str(res["thresh"]))
display.show(img)Traceback (most recent call last): File "<string>", line unknown, in <module> Remote.KeyboardInterrupt
orb 特征提取与匹配 image.cv_orb().match
ORB(Oriented FAST and Rotated BRIEF)是一种快速特征点提取和描述的算法。这个算法是由Ethan Rublee, Vincent Rabaud, Kurt Konolige以及Gary R.Bradski在2011年一篇名为“ORB:An Efficient Alternative to SIFTor SURF”的文章中提出。ORB算法分为两部分,分别是特征点提取和特征点描述。
该实现流程如下:70b4e4e3777ed70f9b3f59724362295470d7f0e4
提取一张图像作为目标物体特征,确定了目标特征后运行匹配函数(match)进行比较,返回识别特征点合集,如果匹配结果在预定的特征范围内,则可以认为是具备同一类特征事物的物体。
感兴趣的同学可以参考该文章:ORB 特征提取算法(理论篇)
(0.5.2 更新)该实现仅供学习和示意,实际表现效果帧率不错,但只适用于一些特定场景下的识别,如果想要泛化更好的效果推荐使用神经网络模型。
from maix import *
orb = image.orb()
print(orb)
# readt a img
src = None
for i in range(5):
src = camera.capture()
display.show(src)
tmp = None
# flag a img
img = camera.capture()
res = orb.match(src, img, limit=50)
if len(res):
for point in res['points']:
# print(point)
img.draw_circle(point[0], point[1], 2, color=(0, 255, 0), thickness=1)
tmp = img.copy().resize(64, 64)
while True:
img = camera.capture()
res = orb.match(src, img, limit=50)
# print(res['x0'], res['y0'], res['x1'], res['y1'])
if len(res):
x, y = res['center']
r = (res['size'][0] + res['size'][1]) // 4
# print(x, y, res['size'], res['angle'])
img.draw_circle(x, y, r, color=(255, 0, 0), thickness=3)
for point in res['points']:
# print(point)
img.draw_circle(point[0], point[1], 4, color=(0, 255, 0), thickness=1)
if len(res['points']):
img.draw_string(0, 0, "keypoints %d" % len(res['points']))
if tmp:
img.draw_image(tmp)
display.show(img)
Traceback (most recent call last):
  File "<string>", line unknown, in <module>
Remote.KeyboardInterrupt
以下为 openmv 版本实现流程,和上述是实现效果一致的,差异在匹配的后处理如何过滤一些数据,让追踪的效果更好。
find_keypoints 找特征点
draw_keypoints 画特征点
match_descriptor 匹配的点
if (match.count()>10): 满足匹配点结果
match.count(), match.theta() 特征物体相对目标物体的旋转角度。
主要看性能和效果了,传统视觉中 orb 的速度是比较快的,就算在嵌入式设备上纯 CPU 运算也有不错的效果。
## 暂未移植接口,实现已经提交。
'''

现已废弃,留做提醒。

> 2022年06月28日 实验了一版 opencv cv::xfeatures2d::SURF 的版本后发现性能太差(2~5fps)基本没法用了,也许 openmv 的特征检测性能会好一些。

commit 28d544aa30a32ce754d7ed2ab370b2d047b98e81 (HEAD -> develop, sipeed/develop)
Author: junhuanchen
Date:   Tue Jun 28 13:48:09 2022 +0800

    [cv::xfeatures2d::SURF] Give up due to poor performance

'''

from maix import *
test = image.cv_surf()
sipeed_logo = image.open("/home/res/_logo.png")
b = image.open("/root/test_image.png")
test.match(sipeed_logo, b, dump=1)
res = image.open("cv_surf_img_matches.jpg")
display.show(res)


 Translate